


IECE Transactions on Advanced Computing and Systems
ISSN: 3067-7157 (Online)
Email: [email protected]

Health is a major global concern, with equitable access to quality healthcare services being a fundamental right recognized by the World Health Organization (WHO) [1]. Cardiovascular diseases, particularly heart attacks, remain a leading cause of mortality, accounting for more than 17 million deaths annually, representing approximately 31% of global fatalities. Heart attacks and strokes alone contribute to 85% of these deaths [2, 3]. Timely diagnosis and effective intervention are crucial to reducing these risks, yet many challenges persist, particularly in resource-limited settings. The scarcity of diagnostic facilities and reliance on highly specialized medical professionals further exacerbate the issue [4, 5, 6]. These limitations significantly hinder early detection and treatment, particularly in developing countries where access to advanced healthcare infrastructure and diagnostic tools is limited [7, 8].
Medical diagnosis, especially for heart diseases, is a complex task requiring accuracy and efficiency [9]. Early detection of cardiovascular conditions is crucial for effective disease management, yet traditional diagnosis methods often rely on manual interpretation of clinical data, which is prone to errors and inefficiencies. Automating heart disease detection through artificial intelligence (AI) and deep learning presents a promising solution [10, 11, 12]. AI-driven predictive models enable healthcare professionals to assess individual risk factors more accurately and provide timely interventions [13]. Analyzing complex medical data, including patient-specific records and incomplete or redundant information, is essential for uncovering patterns that improve prediction accuracy [14]. However, current methodologies still face challenges in handling uncertain and imprecise medical data, which impacts the reliability of diagnosis.
FL has emerged as a powerful technique to handle uncertainty and imprecision in medical data analysis. Unlike traditional binary classification methods, FL incorporates degrees of truth, enabling more flexible and human-like decision-making in clinical diagnosis. Deep learning models, particularly CNNs, have shown remarkable success in medical image processing, enhancing the accuracy of disease detection [15, 16]. While FL and CNNs have individually been explored for heart disease prediction, limited research has focused on their integration to improve diagnostic accuracy. Additionally, while machine learning techniques such as Random Forest [17], Decision Trees [18], K-Nearest Neighbor [19], and Genetic Algorithms [20] have been applied for heart disease prediction, their effectiveness in handling uncertain and fuzzy data remains under-explored.
To address these gaps, this study proposes a FL-based and 1D-CNN model designed for heart disease prediction. The primary research questions guiding this work include:
How can FL improve heart disease prediction by handling uncertainty in patient data?
Can a 1D-CNN model enhance predictive accuracy for structured clinical data?
How can advanced feature selection and data pre-processing techniques contribute to improving classification performance?
Traditional machine learning models such as Random Forest, Decision Trees, and K-Nearest Neighbor (KNN) have been widely used for heart disease prediction. While these methods offer substantial predictive capabilities, they often struggle with handling uncertain, imprecise, and noisy medical data. Additionally, these models typically rely on manually selected features, which may not fully capture the complex interactions within patient health records.
Our proposed approach improves upon these traditional methods in the following ways:
Handling Data Uncertainty: Unlike traditional classifiers, Fuzzy Logic can model the inherent imprecision in medical data, leading to more robust predictions.
Feature Learning: Traditional methods depend on predefined features, whereas the 1D-CNN model automatically extracts relevant patterns from structured clinical data, enhancing prediction accuracy.
Hybrid Approach: By integrating Fuzzy Logic with CNNs, we combine the strengths of both techniques—CNN's capability to detect complex patterns and FL's ability to manage uncertainty.
Improved Performance: The proposed approach demonstrates superior performance in terms of precision, recall, and F1-score, achieving an accuracy of 98.5%, which surpasses the results of traditional classifiers.
Advanced Feature Selection: The use of LassoCV ensures optimal feature selection, reducing dimensionality and improving model efficiency.
This novel integration of FL with CNNs provides a more reliable and efficient framework for heart disease prediction, offering significant advantages over traditional machine learning techniques.
Machine learning and deep learning approaches have been applied to boost the accuracy and efficiency of heart attack diagnosis and prediction. For instance, Hameed et al. [21] utilized a computer-based decision-making system that significantly reduced the time required for heart attack detection, employing supervised learning to enhance diagnostic accuracy. Despite its success, the system's reliance on predefined clinical rules can limit its adaptability to new or unusual cases.
Jansi et al. [22] developed a smartphone application design for real-time heart attack diagnosis and monitoring, achieving over 88% accuracy in cross-validation tests. While this mobile application provides convenience and accessibility, its accuracy and reliability heavily rely on the quality of the input data, which can be affected by user error or device limitations.
Naive Bayes, Decision Tree, and Function Simple Logistic Algorithms have also been explored for heart attack prediction. Waberi et al. [23] investigated these methods, achieving 89%, 87%, and 86% accuracy in Heart Attack Prediction. However, Naive Bayes assumes feature independence, which is rarely true in medical data, potentially restricting their predictive power.
Dileep et al. [24] used the C-BiLSTM technique on the UCI Heart Conditions Dataset, incorporating attributes like weight, heart rate, and cholesterol levels, resulting in a 94.78% prediction accuracy.ul for identifying patterns in data, the K-means clustering algorithm is prone to sensitivity by the initial choice of clusters and may st. It mayith datasets containing noise and outliers.
Lee et al. [25] proposed a method of analyzing respiratory irregularities, achieving a 90% classification success rate. This method, while effective, is limited by the specificity of the respiratory data, which may not capture all relevant factors for heart attack prediction.
Hidayat et al. [26] introduced the Hybrid Random Trees (CADD), which combines random trees, decision trees, and support vector machines, resulting in a 91.47% accuracy rate. The (CADD), though powerful, demands computational resources and may require careful parameter tuning to achieve the best performance.
| References | Techniques | Achievements | Limitations |
|---|---|---|---|
| Dileep et al. [24] | Clinical decision-making system | Reduced detection time and improved diagnostic accuracy of 94.78% | Relies on predefined clinical rules, limiting adaptability to new cases |
| Hidayat et al. [26] | Naive Bayes classifier | Achieved 91.47% classification accuracy | Assumes feature independence, which is often untrue in medical data |
| Sunnetha et al. [27] | K-means clustering | Achieved 96% prediction accuracy | Sensitive to initial cluster selection and noisy data |
| Lee et al. [25] | Analysis of respiratory irregularities | 90% success rate in classification | Limited scope due to specific respiratory data |
| Nandy et al. [28] | Hybrid Linear Regression Model (HLRM) | 95.78% accuracy rate | High computational demands, requires careful tuning |
| Rani et al. [29] | Backpropagation ANN | 86.6% classification accuracy | Considered a "black box"; low interpretability |
| Bhatt et al. [30] | ANN | High accuracy for cardiovascular classification | Prone to overfitting, hard to interpret |
| Menshavi et al. [31] | ML model comparison | 95.6% accuracy | SVMs need precise tuning, computationally heavy |
| Saeedbakhsh et al. [32] | Machine learning | Up to 87.69% accuracy | Highly dependent on dataset quality |
| Ozcan et al. [33] | Clustering techniques | Predicts heart attacks | Sensitive to parameter tuning, risk of overfitting |
| Biswas et al. [34] | Feature selection | Shows feature importance in predictions | Requires diverse, high-quality datasets |
Artificial neural networks (ANN) based on backpropagation have also shown promise. Suneeta et al. [27] utilized a convolutional neural network with adapted backpropagation to classify cardiovascular disease, achieving an accuracy of 96%, and Nandy et al. [28], a swarm-artificial neural network was used to predict heart disease, achieving 95.78% accuracy. Despite their high accuracy, ANNs are considered black boxes, providing little insight into decision-making processes in medical applications.
Rani et al. [29] the study evaluated support vector machine, naive Bayes, logistic regression, random forest, and AdaBoost classifier, with an accuracy rate of 86.6%. Although SVMs are effective in high-dimensional spaces, they can have a high computational demand and require precise tuning of kernel parameters. Decision trees, on the other hand, are more interpretable but can suffer from overfitting, especially with small datasets.
Further research has explored machine learning models' application to various sources' datasets, improving prediction accuracies, and providing insights into feature selection. For example, Bhatt et al. [30] and Menshavi et al. [31] utilized different datasets and machine learning techniques, achieving accuracies up to 87.28% and 95.6%, respectively. However, the variability in dataset quality and feature selection methods can lead to inconsistent performance across different studies.
Studies on support systems for coronary artery disease classification have also been conducted. Saeedbakhsh et al. [32] employed SVM and ANN to classify coronary heart disease, while Ozcan et al. [33] utilized clustering techniques to predict heart attacks. Biswas et al. [34] emphasized the significance of feature selection in machine learning approaches for heart attack prediction. Although the field has advanced, these studies often face challenges related to the generalizability and scalability of the models. Table 1 summarizes the techniques, accomplishments, and limitations of recent works on heart attack prediction.
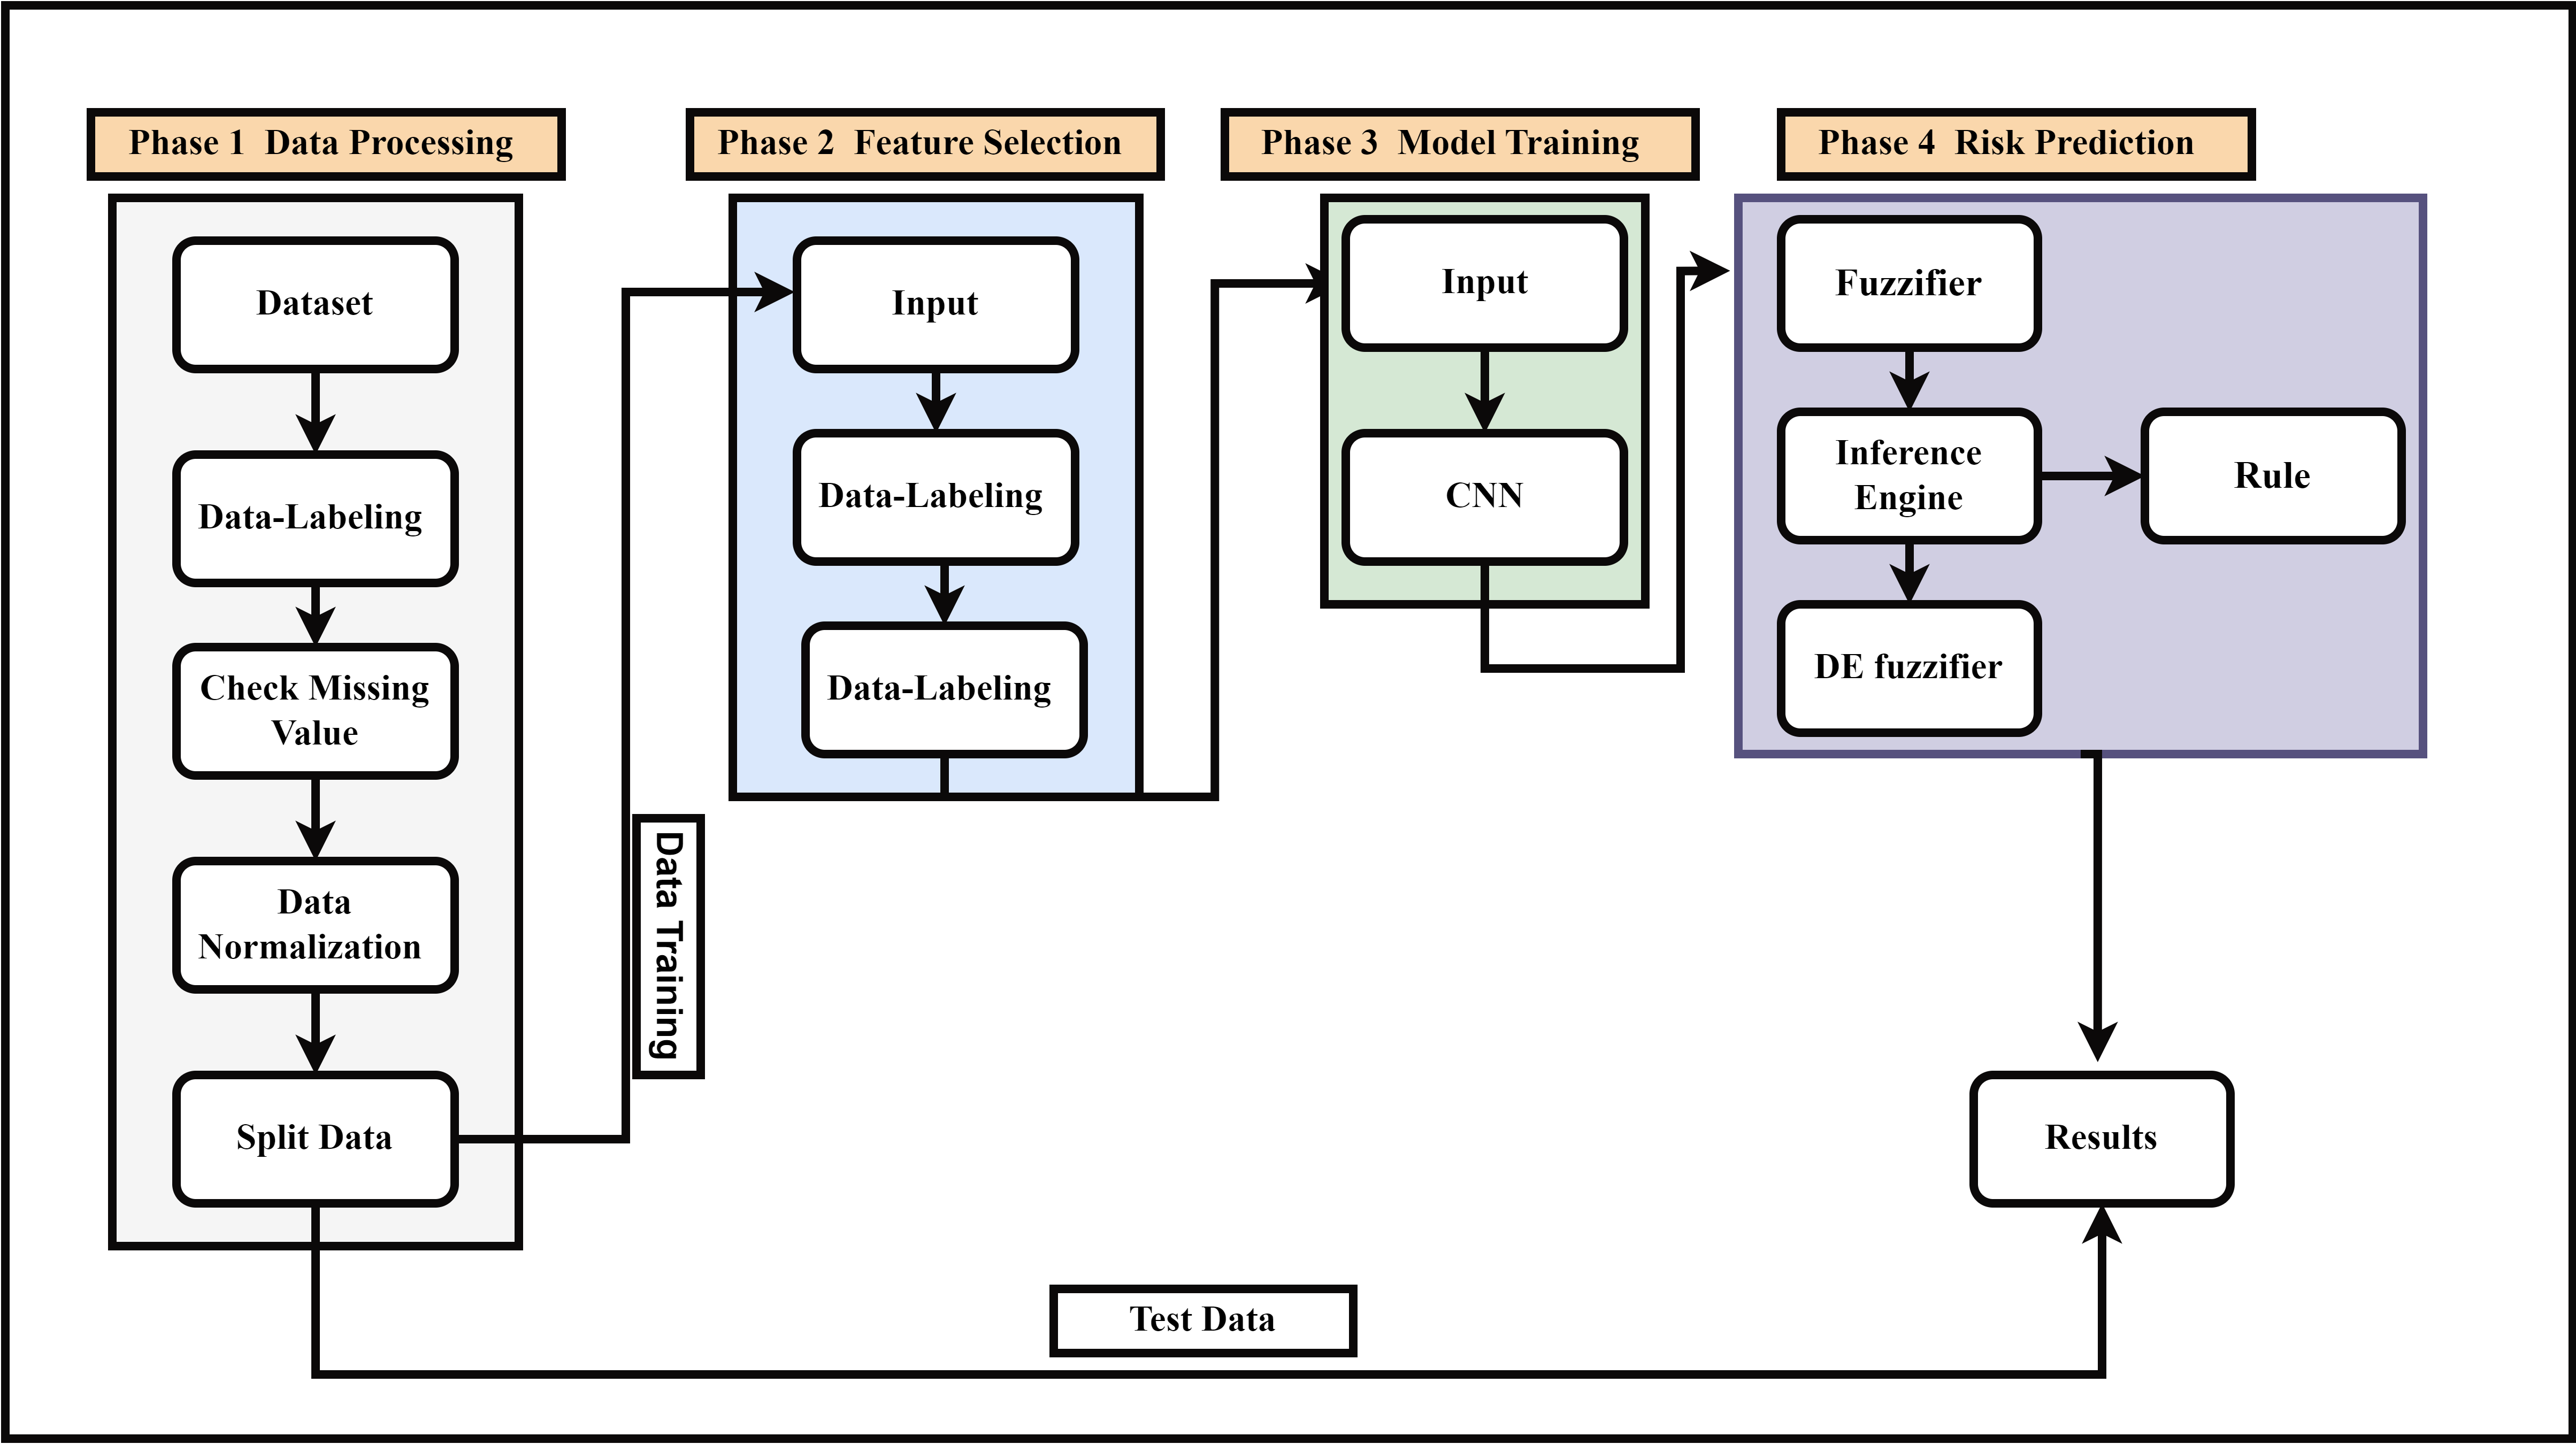
In this section, we will explain how we will apply the models to the UCI Heart dataset employed in the study. In Phase 1: data Processing, the raw data is prepared for supervised learning by assigning labels, identifying and addressing any missing values, normalizing the dataset, and then splitting it into training and testing subsets. Phase 2: Feature Selection identifies the most relevant features by feeding labeled data into the feature selection pipeline, ensuring only the most significant attributes are award. In Phase 3: Model Training, a Convolutional Neural Network (Clearnsearn complex patterns from the selected features. Finally, in Phase 4: Risk Prediction, fuzzy logic is incorporated to enhance prediction accuracy. This involves converting crisp inputs into fuzzy values through a fuzzifier, applying fuzzy inference rules via an inference engine, and then converting the fuzzy output back into a crisp prediction using a defuzzifier. The results are derived from the combination of CNN-based learning and fuzzy logic. Throughout this process, the training data from Phase 1 is used for feature selection and model training, while the test data are applied to evaluate the trained model and generate predictions. The entire methodology is designed to preprocess the data, select key features, train a CNN model, and apply fuzzy logic to improve prediction accuracy. Moreover, the block diagram for the suggested model is shown in Figure 1. The primary objective of this research is to improve and measure predictive models for heart attack risk focusing on deep learning methods, especially CNN and FL. Accurate prediction of heart attacks is crucial for timely intervention and treatment.
The Heart Disease dataset from the UCI Machine Learning Repository contains 303 records and 14 features, including both continuous (e.g., age, serum cholesterol) and categorical (e.g., sex, chest pain type) variables. It is widely used in heart disease prediction research, making it a suitable choice for testing machine learning models in medical applications.
The dataset includes a mix of continuous and categorical variables. The age range is between 29 and 77 years, with the sex distribution being imbalanced (68.3% male, 31.7% female). Chest pain type is fairly balanced, while serum cholesterol is skewed, with most values below 350 mg/dl.
There is class imbalance (45.5% with heart disease), and gender imbalance, with more males than females. The dataset also lacks extreme age groups, limiting its applicability to younger or older individuals.
This dataset was chosen due to its relevance to heart disease prediction and its wide use in research. It offers a manageable size (303 records) and diverse features for model testing and comparison.
The dataset is not fully representative of global populations, with biases in gender, age, and geographical diversity. Future research could include more diverse data to improve model generalization.
Table 2 provides an overview of these attributes. The dataset is available for access online through the UCI machine learning repository: https://archive.ics.uci.edu/ml/datasets/Heart+Disease.
| No. | Attribute | Explanation |
|---|---|---|
| 01 | Age | Age of the individual in years |
| 02 | Gender | 1 = Male, 0 = Female |
| 03 | CP | Category of chest pain experienced |
| 04 | Trestbps | Blood pressure measurement at rest, expressed in mm Hg |
| 05 | Chol | Concentration of serum cholesterol in mg/dl |
| 06 | FBS | Fasting blood glucose level greater than 120mg/dl (1 = Yes, 0 = No) |
| 07 | Restecg | Electrocardiogram results taken at rest |
| 08 | Thalach | Highest heart rate recorded during testing |
| 09 | Exang | Presence of exercise-induced angina (1 = Yes, 0 = No) |
| 10 | Oldpeak | ST segment depression during exercise relative to rest |
| 11 | Slope | Gradient of the ST segment during peak exercise |
| 12 | CA | Count of major blood vessels visualized via fluoroscopy |
| 13 | Thal | Thalassemia type (3 = Normal, 6 = Fixed defect, 7 = Reversible defect) |
| 14 | Target | Presence of heart disease (0 = No, 1 = Yes) |
The dataset was cleaned to address missing values and uphold consistency across attributes. Missing values were imputed using mean or median values as appropriate.
Continuous variables were normalized to achieve a zero mean and unit variance and to facilitate efficient model training.
where represents the original value, is the variable's mean, and is the standard deviation.
Each data instance was labeled with clinically relevant information, including age, gender, and health history. Accurate labeling is crucial for developing reliable predictive models and for subsequent analysis.
LASSO is a feature selection method utilizing L1 regularization to simplify the model by removing irrelevant features. The LassoCV class from the linear model library was used with 5-fold cross-validation to automto-tune the regularization parameter automaticallyASSO method minimizes the objective function:
where is the number of observations, is the target variable, is the input vector for the -th observation, represents vector of coefficients, represents features counting, and represents the regularization parameter.
The proposed 1D-CNN model is designed to process one-dimensional data, making it particularly well-suited for tasks involving time-series or sequential data. Unlike conventional 2D CNNs, which are applied to two-dimensional inputs such as images, our 1D-CNN focuses on learning patterns from a single dimension (e.g., time or sequence). This is achieved through convolution operations along one axis, enabling the model to efficiently capture local temporal dependencies.
Mathematically, the convolution operation for a 1D-CNN can be expressed as:
where is the input sequence at time , is the filter or kernel of size , and denotes the convolution operation. This operation is applied across the input sequence to extract local features.
The architecture of the 1D-CNN typically includes several 1D convolutional layers followed by pooling layers. The pooling operation can be represented as:
where is the window size for pooling, and the max function selects the most dominant feature in the local neighborhood. These layers are followed by fully connected layers that generate the final prediction.
One significant advantage of the 1D-CNN over conventional 2D CNNs is its computational efficiency. Traditional 2D CNNs apply convolutions over both spatial dimensions (width and height) of an image, which requires larger filters and higher computational cost. In contrast, 1D-CNNs operate over a single dimension, which reduces the number of parameters and operations, making it faster to train and less computationally expensive. For example, the number of parameters in a 2D convolution is:
where is the filter size, is the number of input channels, and is the number of output channels. In a 1D-CNN, the number of parameters is:
leading to a reduction in the total number of computations.
CNNs were chosen for their capability to deal in complex and high-dimensional data. The CNN architecture was designed to identify key attributes from the provided data, followed by fully connected layers for classification.
The CNN model includes convolutional, pooling, and fully connected layers convolutional layers perform a convolution operation on the input:
where denotes the filter matrix, is the input matrix, and are the indices used in the output matrix.
The convolutional layer's output is passed through a non-linear activation function, typically the RELU (Rectified Linear Unit):
The data was partitioned into two sets in a way that 80% was used in the training set and 20% in the validation set. The models were trained with the training dataset and the process of hyperparameter tuning as well was performed over the data splits of the validation set. The Adam optimizer was utilized to train the CNN, with early stopping applied to avoid overfitting. The Adam optimizer updates the weights using the following equations:
where and represent the first and second moment estimates, and are the decay rates, is the gradient, is the learning rate, and is a small constant.
FL is integrated into the CNN model to enhance decision-making under uncertainty by incorporating linguistic variables and fuzzy membership functions. Instead of relying solely on crisp decision boundaries, the proposed model uses fuzzy set to handle ambiguous or imprecise input data. The fuzzy system consists of three key components: fuzzification, inference, and defuzzification.
The input features of the CNN, denoted as , are transformed into fuzzy values using membership functions , which map crisp inputs into fuzzy sets:
where is the shape parameter, and is the center of the fuzzy set. This allows input values to belong to multiple categories with varying degrees of membership.
FIS is integrated into the CNN layers to modify feature maps based on fuzzy rules. A set of fuzzy IF-THEN rules is applied:
where , , and are fuzzy sets. The rule strength is computed using the T-norm operator, typically a product operation:
This weight is then applied to modify the activation maps in the CNN layers, enhancing feature extraction under uncertain conditions.
To make final predictions, defuzzification is performed using the centroid method, which converts fuzzy outputs into crisp values:
where is the centroid of the fuzzy region associated with rule . This step ensures that the CNN model outputs precise classifications even with uncertain or noisy inputs.
We evaluated the model's accuracy, precision, recall, and F1-score. By using these metrics, you can evaluate a model's classification abilities and overall effectiveness based on the dataset.
The proportion of correctly predicted instances by the total instances as shown in equation (18):
Precision shows the fraction of positive identifications that are truly correct. It can be found out through the following equation (19):
where False Positives are represented by and True Positives by .
Recall (sensitivity) evaluates how well the method identifies the real positive instances. It can be measured through the following equation (20):
where stands for False Negatives and for True Positives.
F-Measure, also known as the F1 Score, combines both Recall and Precision into a single metric. The formula for calculating it:
The loss function is essential in training a deep learning model, as it quantifies the difference between the model's predictions and the actual outcomes. Two primary types of loss are monitored during the training process: training loss and validation loss.
Training loss evaluates the error in the training data over each training process. It reflects how well the model adjusts its weights and biases to fit the training data. The training loss is computed after each epoch (complete pass over the training dataset) and offers an indication to measure how well the model is learning from the training data. Mathematically, the training loss at epoch can be defined as equation (22):
where represents the number of training samples, is represents the loss function, represents the true label, and denotes the predicted label.
Validation loss quantifies the error on a distinct validation dataset that is not involved in the training process. It serves as a measure of how well to predict outcomes to previously unseen data. Analyzing the validation loss helps uncover overfitting issues, where the model achieves high accuracy on the training data but fails to generalize on the validation data. Mathematically, the validation loss at epoch can be defined as:
where indicates number of validation samples, Indicates loss function, Indicates true label, and denoted the predicted label.
| References | Methods | Accuracy |
|---|---|---|
| [44] | Multi-task neural network | 90.09% |
| [45] | Adaptive Boosting | 85.28% |
| [45] | Bagging | 86.37% |
| [45] | Stacking | 87.24% |
| [46] | Random-Forest | 86.93% |
| [47] | Stacking | 89.86% |
| [48] | K-nearest neighbor + ICA | 88.25% |
| [35] | Feature Learning , Improved C4.5 algorithm | 94.55% |
| [36] | Stacked Weighted Nearest Neighbor (SWNN) | 78 to 98% |
| [37] | CNN + RNN | 96.51% |
| [38] | Logistic Regression Classifier | 88.16% |
| [43] | ensemble learning approach | 98% |
| Proposed Method | CNN, FL | 98.5% |
In this section, we discuss the evaluation outcomes of our devised CNN, FL deep learning model, and compare its performance with varied benchmarks. The results are compared based on accuracy, precision, recall, and F-score metrics, such as are useful for understanding the learning process of the models and how they perform on new test data. The CNN and FL outperform all other models in terms of accuracy shown in Table 3. While comparing the model in terms of Precision, recall, and F-measure are shown in Table 4, which shows the proposed model capabilities.
| Reference | Methods | Accuracy | Recall | Precision | F-Measure |
|---|---|---|---|---|---|
| [39] | Logistic Regression | 92% | 97% | 88% | 92% |
| [40] | Deep learning | 82.49% | 77.08% | 87.24% | 84.41% |
| [29] | Adaboost | 86.59% | 83.53% | 88.96% | 86.16% |
| [41] | lightweight CNN | 94.09% | 91.71% | 91.82% | - |
| [42] | MLP-EBMDA | 94.28% | 96% | 96% | 96% |
| Proposed Method | CNN, FL | 98.50% | 97% | 100% | 98.50% |
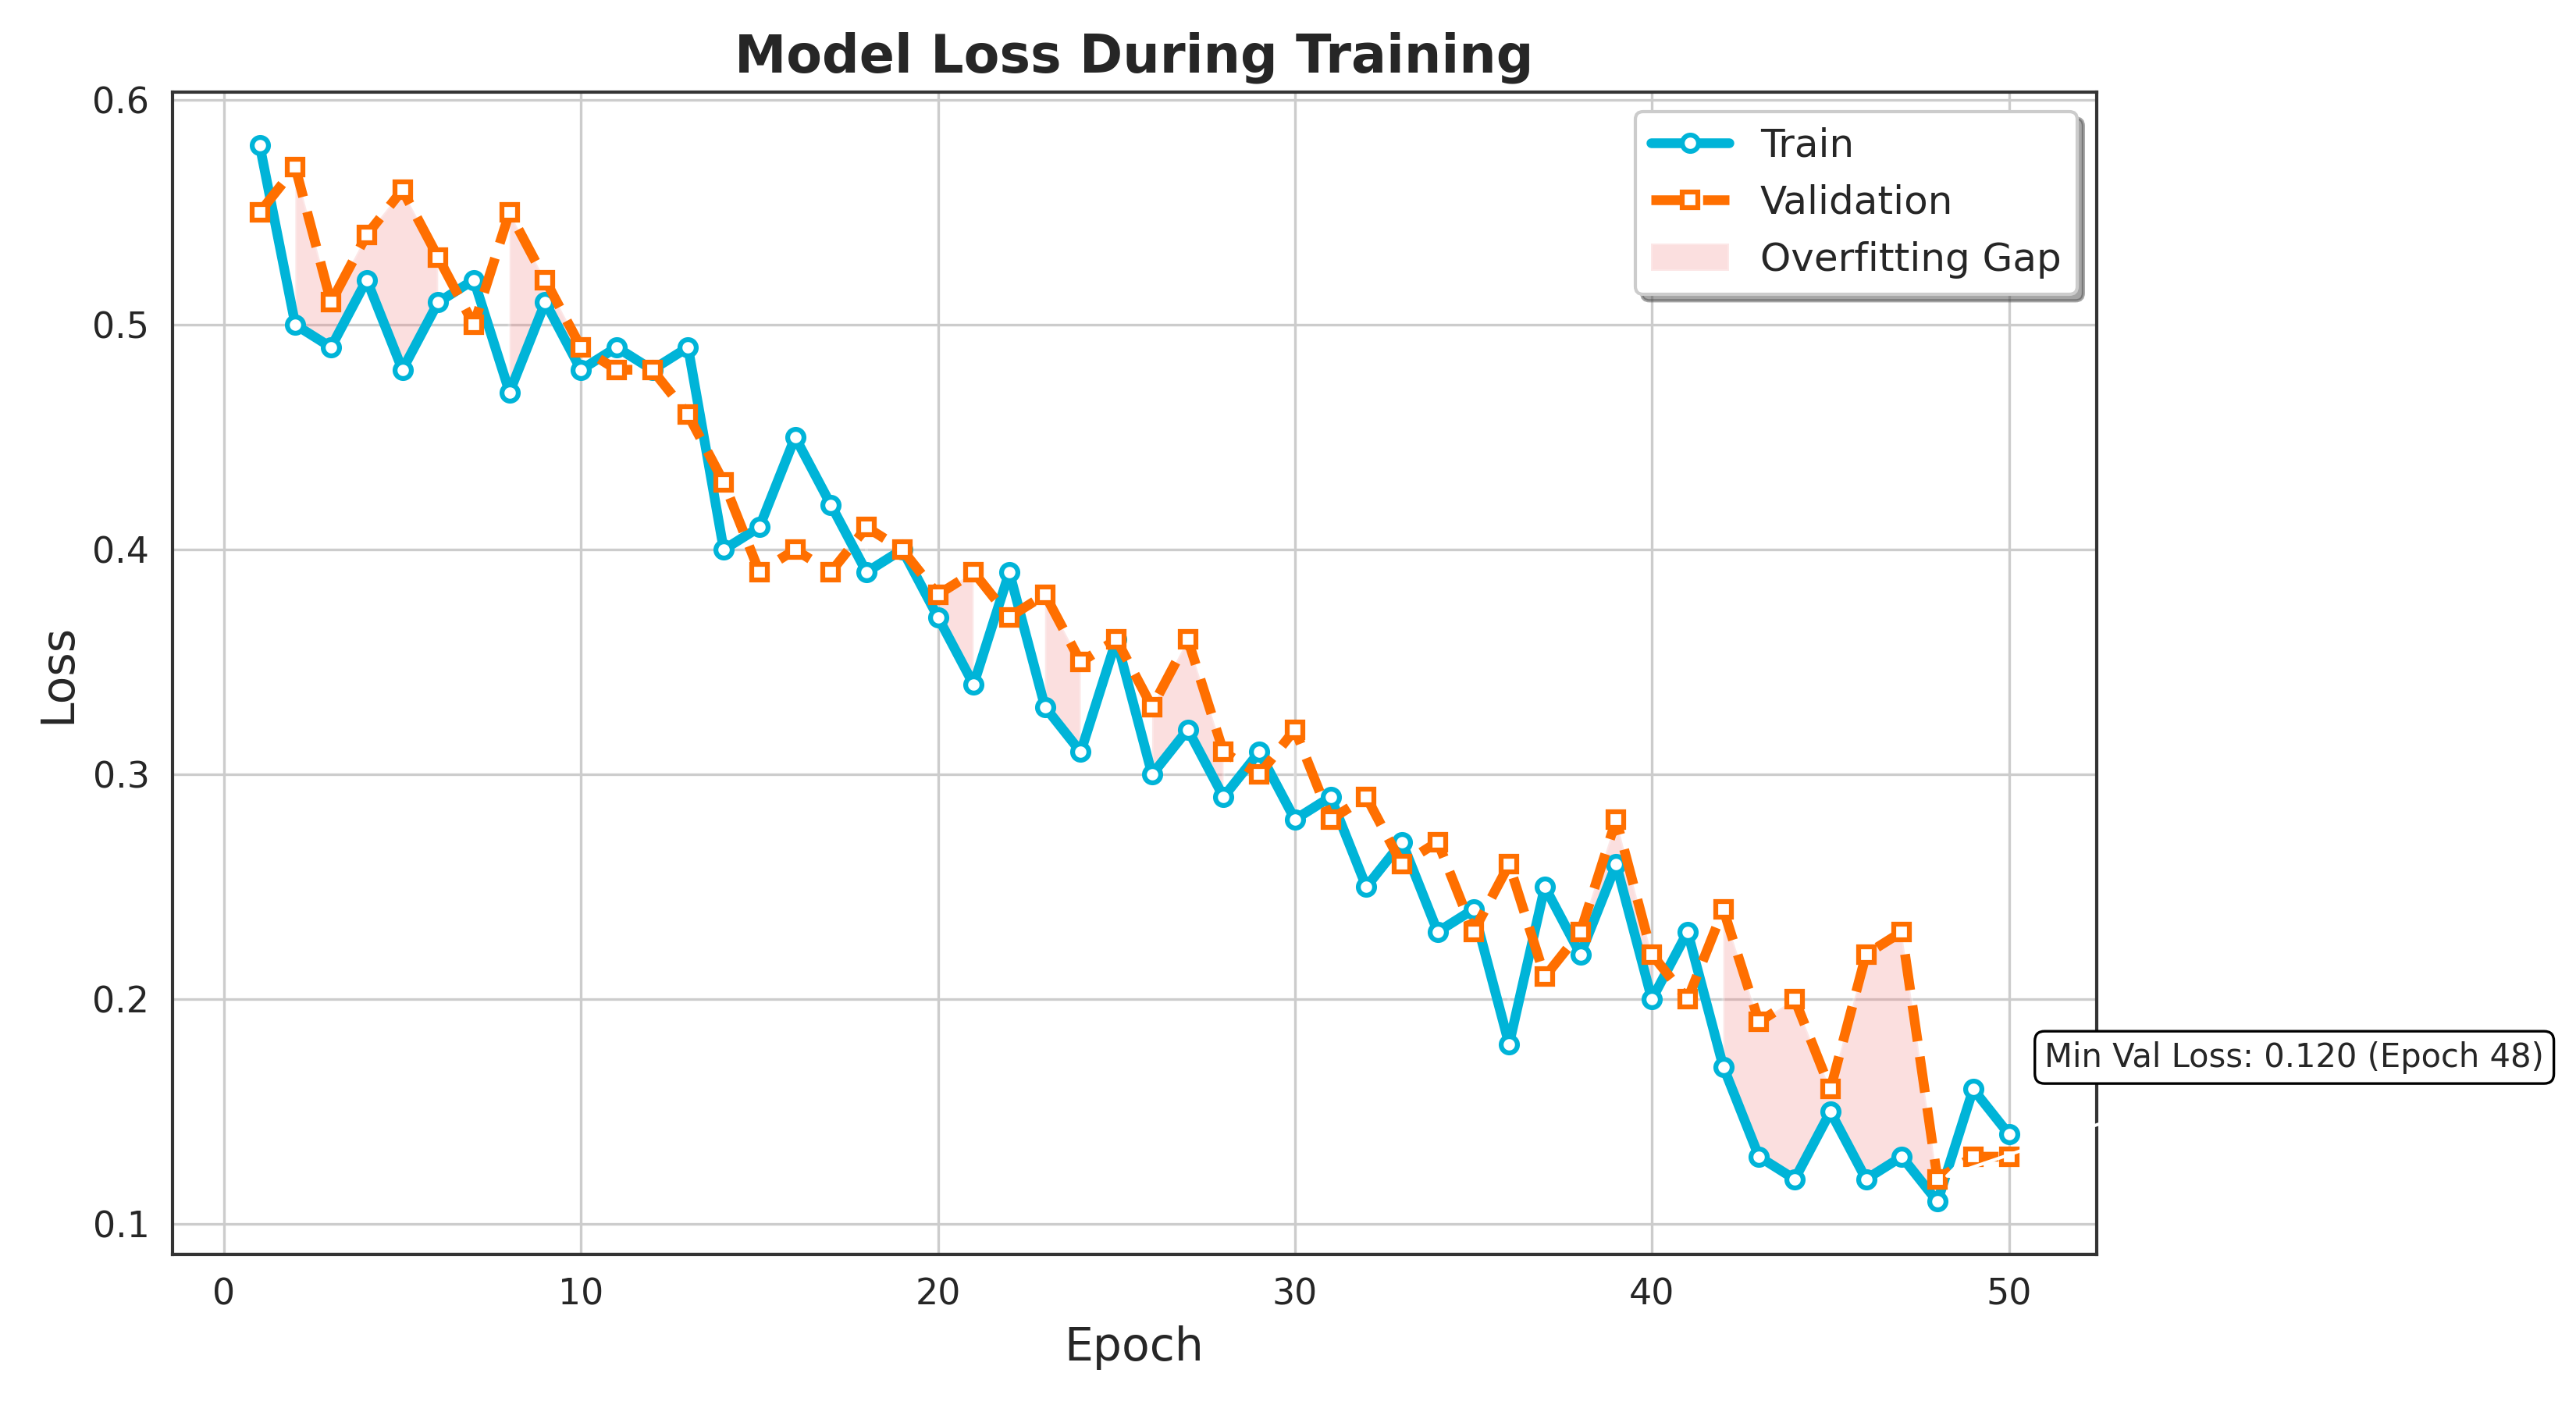
The training and validation loss is shown in Figure 2. Depicts the training and validation loss curves for training and validation over 50 epochs for the model. Both the training loss depicted in blue alongside validation loss in orange show a general downward trend, indicating that the model is progressively learning and enhancing its performance over time. Initially, both losses are relatively high, but as training progresses, the losses decrease significantly, suggesting that the model is gradually fitting the training data and optimizing its predictions on the validation set. There are minor fluctuations in both curves, which can be attributed to the stochastic nature of the training process, but the overall loss reduction is consistent. Importantly, there is no significant divergence between the training and validation losses, which implies that the model generalizing well and not overfitting the training data and is generalizing well to unseen data. This indicates a balanced learning process, as both losses decrease in tandem, showing the model's proficiency to generalize without losing predictive performance on the validation dataset.
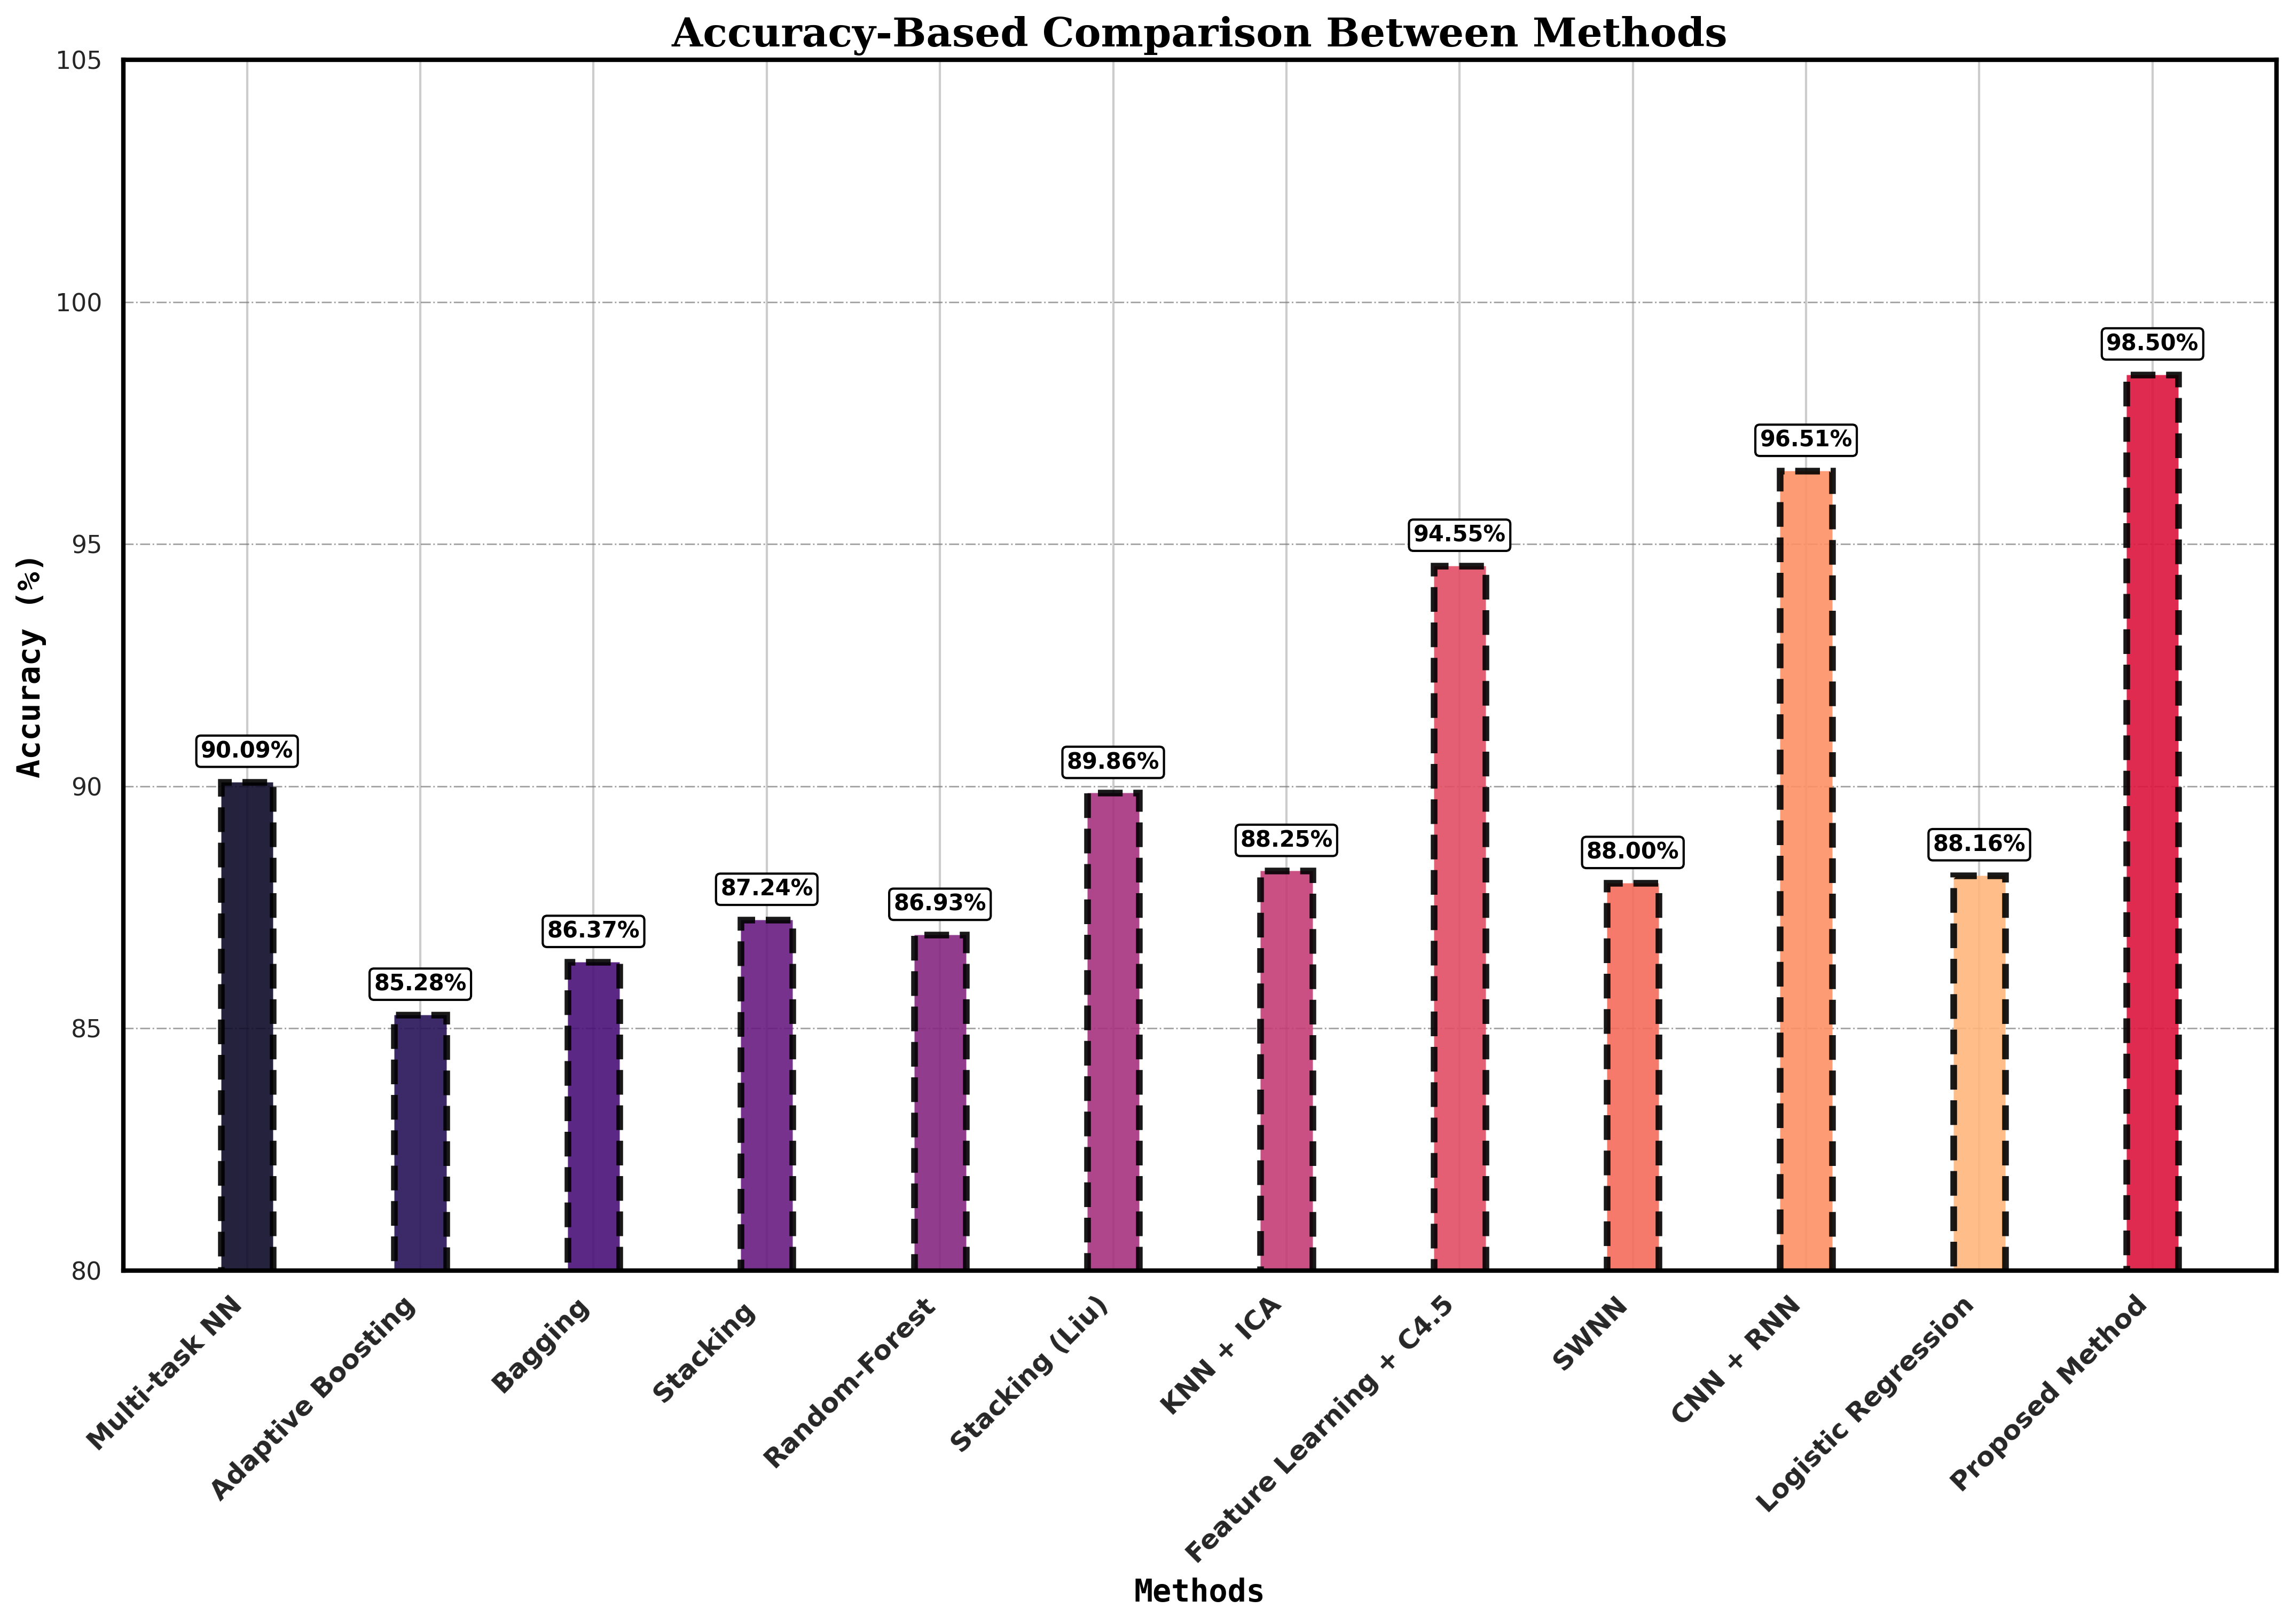
The proposed method, which combines Convolutional Neural Networks (CNN) and Fuzzy Logic (FL), achieves the highest accuracy of 98.5%, as shown in Figure 3, surpassing other techniques. The next best approach uses a combination of CNN and Recurrent Neural Networks (RNN) by Rahman et al. [37], achieving 96.51%. Other methods, such as the multi-task neural network by García-Ordás et al. [44] and stacking techniques by Liu et al. [47], reported accuracies of 90.09% and 89.86%, respectively. In contrast, traditional machine learning methods like Adaptive Boosting 85.28% and Random Forest 86.93% showed lower performance. The feature learning method using the improved C4.5 algorithm by Muhammad et al. [35] reached a high accuracy of 94.55% but still falls short compared to the proposed method. Table 3, demonstrates that deep learning-based methods, particularly the proposed CNN-FL approach, significantly improve predictive accuracy compared to classical techniques.
.png)
Figure 4 illustrates the FPR values for various models compared to the proposed method. This plot helps to illustrate and contrast the evaluation of different models based on their false positive rates, providing a clear view of which models are more or less prone to false positive errors.
The proposed CNN-based approach, combined with Fuzzy logic (FL), achieves the highest accuracy of 98.5%, surpassing several well-established models. The logistic regression model from Berdinanth et al. [39], achieved a notable accuracy of 92%, with a strong recall of 97% but slightly lower precision at 88%, leading to an F-measure of 92%. Almazroi et al. [40] employed a deep learning approach, yielding an accuracy of 82.49% and a high precision of 87.24%, although the recall was lower at 77.08% and F-measure of 84.41%. Rani et al. [29] used an Adaboost model, attaining an accuracy of 86.59%, balanced recall and precision 83.53% and 88.96%, respectively, and an F-measure of 86.16%. Malibari et al. [41] applied a lightweight CNN, delivering an impressive accuracy of 94.09% and near-identical recall and precision values around 91.71%,91.82%. Another model, MLP-EBMDA by Deepika et al. [42] demonstrated high accuracy 94.28% and balanced recall and precision 96%, reflected in an F-measure of 96%. In contrast, the proposed method integrating CNN and fuzzy logic significantly outperforms these models with a remarkable accuracy of 98.50%, recall 97% with perfect precision at 100%, and a high F-measure of 98.50%. This demonstrates the superiority of the proposed hybrid approach in enhancing heart attack risk prediction. Moreover, the plot shown in Figure 5 effectively demonstrates the superior results of the proposed CNN-FL model outperform other models, making it a strong candidate for applications where high Recall, Precision, and F-Measure are critical.
.png)
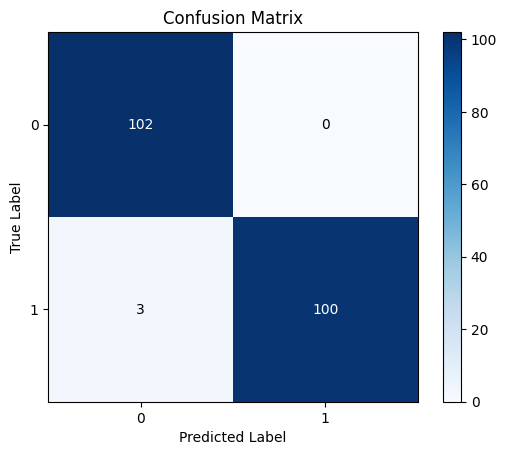
The confusion matrix illustrates the effectiveness of binary sorting by comparing expected category labels with actual class names for a given amount of test data. This is the confusion matrix. A binary classification consists of true upbeats, true negatives, fake upbeats, and false negatives. In this case, 'excellent' refers to the positive class and 'negative' to the negative class. TP represents the correct identification of the positive class, while NP denotes the correct identification of the negative class. It gives a thorough overview of how well the binary system of classification worked, which lets scholars look at the model's pros and cons. Researchers can find parts of the model that need improvement by looking at how often genuine positives, true negatives, false positives, and counterfeit negatives happen. Then they take the right steps to make the model work better. In Figure 6, it is depicted how the suggested model turned out.
This section describes the implementation of an FL system to assess risk levels based on age implementing with visualization of the results. FL allows for handling the imprecision and uncertainty inherent in real-world data by defining membership functions and rules that mimic human reasoning. We define three age-based membership functions:
Young Age: Provides a membership value indicating how much age is categorized as youthful.
Middle Age: Provides a membership value indicating how much an age is categorized as intermediate.
Old Age: Provides a membership value indicating how much an age is categorized as advanced.
similarly, two risk score-based membership functions are defined:
Low Risk: Provides a membership value indicating the extent to which a risk score is classified as minimal.
High Risk: Provides a membership value indicating the extent to which a risk score is classified as elevated.
The membership values for age are calculated for each individual in the test dataset. For risk scores, the numerical values from the predicted risk scores are used to calculate their membership values. We then define three fuzzy rules:
Rule 1: When the age is classified as young or the risk score is assessed as low, the risk level is categorized as low.
Rule 2: When the age falls into the middle-aged category or the risk score is evaluated as low, the risk level is categorized as low.
Rule 3: When the age is considered old or the risk score is rated as high, the risk level is categorized as high.
The final risk score for each individual is determined by taking the maximum value among the three rules. This approach ensures that the most significant factor among age and risk score determines the risk level.
It is a critical measure for determining the performance of classification models, particularly when the cost of false positives carries a high cost. The FPR tracks how many negative cases are incorrectly classified as positive. It is computed using the following equation:
A certain number of false positives (FP) and true negatives (TN) are present. FPR provides insight into the likelihood that a model will incorrectly classify a negative instance as positive, which is particularly important in applications such as the detection of fraud or medical assessments, where erroneous positive findings could cause major ramifications.
Heart attacks are still among the top causes of mortality worldwide, making early and accurate risk prediction essential for successful prevention and prompt intervention. The paper provides a novel method for estimating the risk of heart attacks by using CNNs and FL. It contains 76 parameters in the UCI Heart Dataset, and 14 important predictors were found using LassoCV to aid in feature selection. A specialized 1D-CNN model was developed, achieving exceptional results with a 98.5% accuracy, 100% precision, 97% recall, and 98.5% F1 score. Incorporating FL allowed for handling uncertainties in the data, enhancing the model's forecasting accuracy and reliability. The design model and rule-based decision-making provided a nuanced risk assessment based on the patient's age and risk profile, offering a practical tool for healthcare professionals.
This study emphasizes the effectiveness of coupling deep learning with FL to develop highly accurate and reliable heart attack risk prediction models. By integrating feature selection, advanced modeling techniques, and uncertainty handling, the research presents a comprehensive approach to heart attack risk assessment. Continued advancements in this field have the potential to completely transform cardiovascular medicine, improving patient outcomes and healthcare delivery. To improve model performance, interpretability, and ethical deployment in clinical settings, current research and development efforts must be pursued.
The proposed model shows remarkable performance in predicting heart attack risk, several challenges and limitations must be acknowledged. These include the computational cost of training deep learning models, potential biases in the dataset, and the critical importance of data quality and availability. Additionally, the model's lack of interpretability, the risk of overfitting, and the complexities of integrating fuzzy logic with CNNs present further hurdles. Moreover, real-world deployment could face challenges related to data inconsistencies and system integration. Addressing these issues is essential for improving the model's robustness, generalizability, and applicability in practical healthcare environment.
Future work could delve into incorporating sophisticated deep learning methods, including LSTM and recurrent neural networks, to improve predictive accuracy. Establishing a real-time data collection environment using lot sensors would enable comprehensive evaluation and validation of the proposed method. Incorporating explainable Al methods will facilitate clarity and trust in the model's predictions, facilitating clinical decisions. Additionally, addressing ethical considerations and ensuring model impartiality through rigorous data evaluation and ethical rules will be crucially reliable for use in healthcare.
 Copyright © 2024 by the Author(s). Published by Institute of Emerging and Computer Engineers. This article is an open access article distributed under the terms and conditions of the Creative Commons Attribution (CC BY) license (https://creativecommons.org/licenses/by/4.0/), which permits use, sharing, adaptation, distribution and reproduction in any medium or format, as long as you give appropriate credit to the original author(s) and the source, provide a link to the Creative Commons licence, and indicate if changes were made.
IECE Transactions on Advanced Computing and Systems
ISSN: 3067-7157 (Online)
Email: [email protected]

Portico
All published articles are preserved here permanently:
https://www.portico.org/publishers/iece/